User Guide for Policy Makers
Comprehensive guide to using FairChoices for health benefit package design and policy analysis
Getting Started
Welcome to FairChoices! This comprehensive guide will walk you through using the FairChoices DCP Analytics Tool for policy making and health benefit package design.
Download Policymaker Guide PDF
Quick Start
To begin using FairChoices, navigate to https://fairchoices.uib.no/ and select your country or region of interest.
What is FairChoices?
FairChoices is a decision-support platform designed to help policymakers design evidence-based health benefit packages. The tool provides comprehensive analysis of health interventions, cost-effectiveness data, and population health impact estimates.
Key Features
Evidence-Based Analysis
Access comprehensive data on intervention effectiveness, costs, and health impact based on peer-reviewed research and global health databases.
Interactive Interface
User-friendly dashboard with intuitive navigation, interactive charts, and customizable analysis parameters.
Multi-Criteria Decision Analysis
Compare interventions based on cost-effectiveness, equity considerations, and budget impact simultaneously.
Country-Specific Data
Tailored analysis using country-specific demographics, epidemiology, and health system data.
Interface Overview
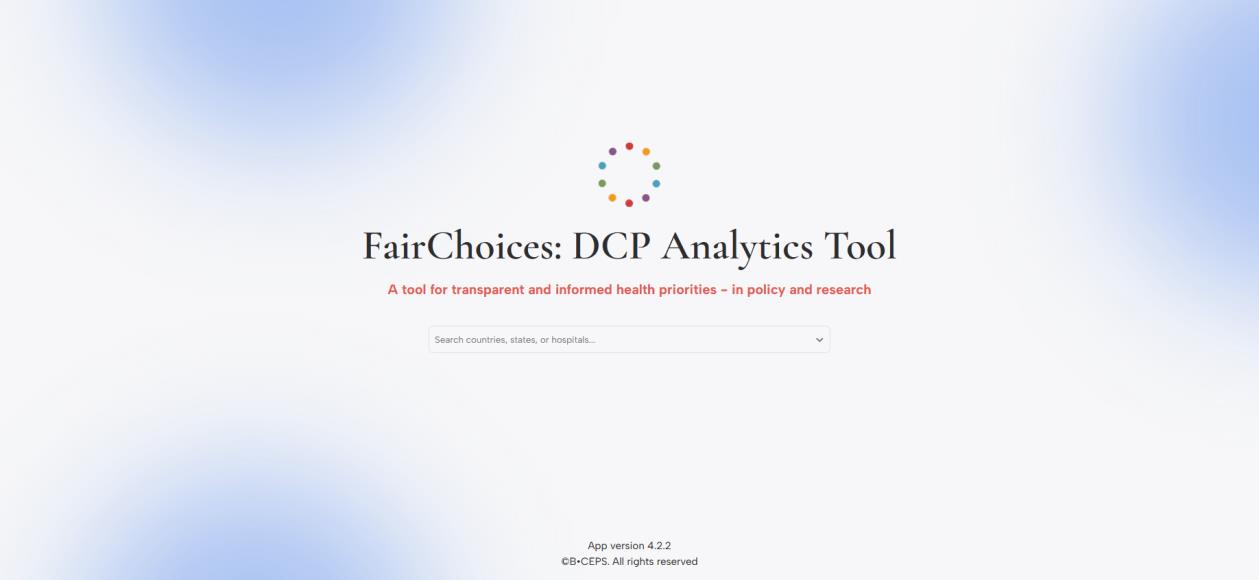
The FairChoices interface is designed with simplicity and functionality in mind. Here’s what you’ll see when you first access the tool:
FairChoices DCP Analytics Tool homepage with search functionality
Main Components
- Search Bar: Located prominently in the center, allowing you to search for countries, states, or hospitals
- Logo and Branding: FairChoices logo with tagline “A tool for transparent and informed health priorities – in policy and research”
- Dark Mode Toggle: Moon/sun icon in the top right corner for switching between light and dark themes
- Version Information: App version and copyright information displayed in the bottom right
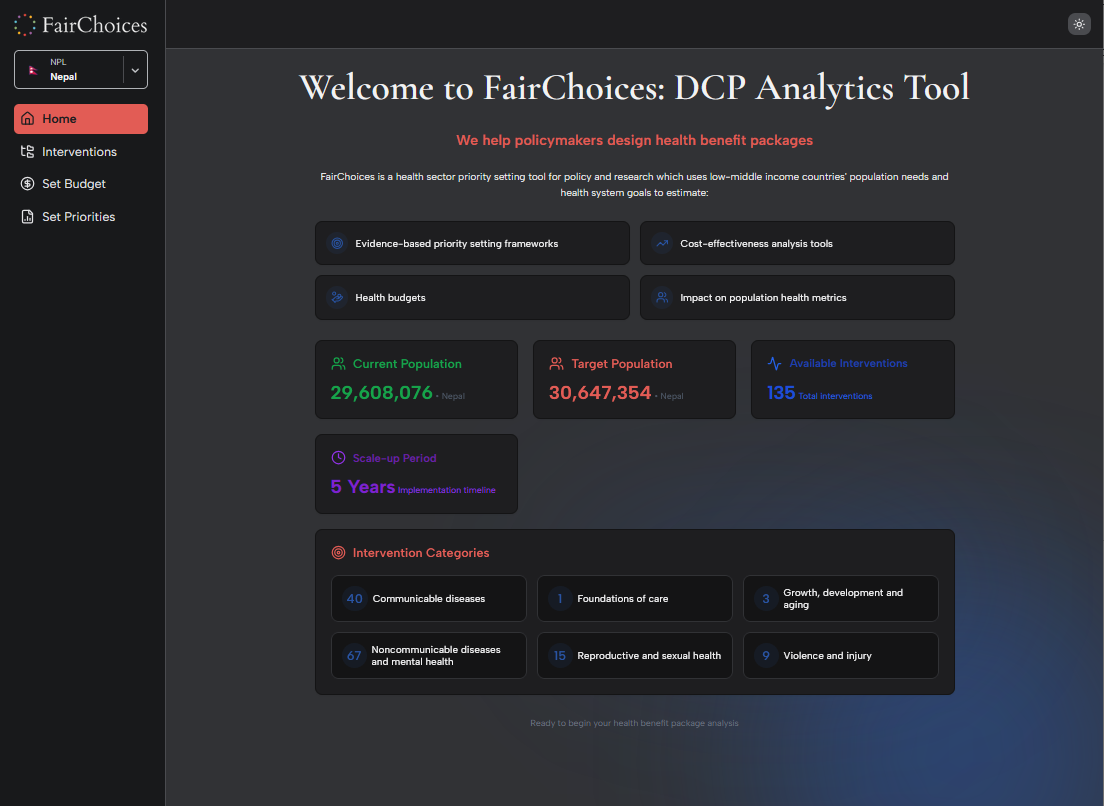
Dark Mode
FairChoices supports both light and dark modes for user comfort. Click the moon symbol to switch to dark mode, and the sun symbol to return to light mode.


Selecting Your Location
The first step in using FairChoices is selecting your geographic area of interest. This ensures all analysis is tailored to your specific context.
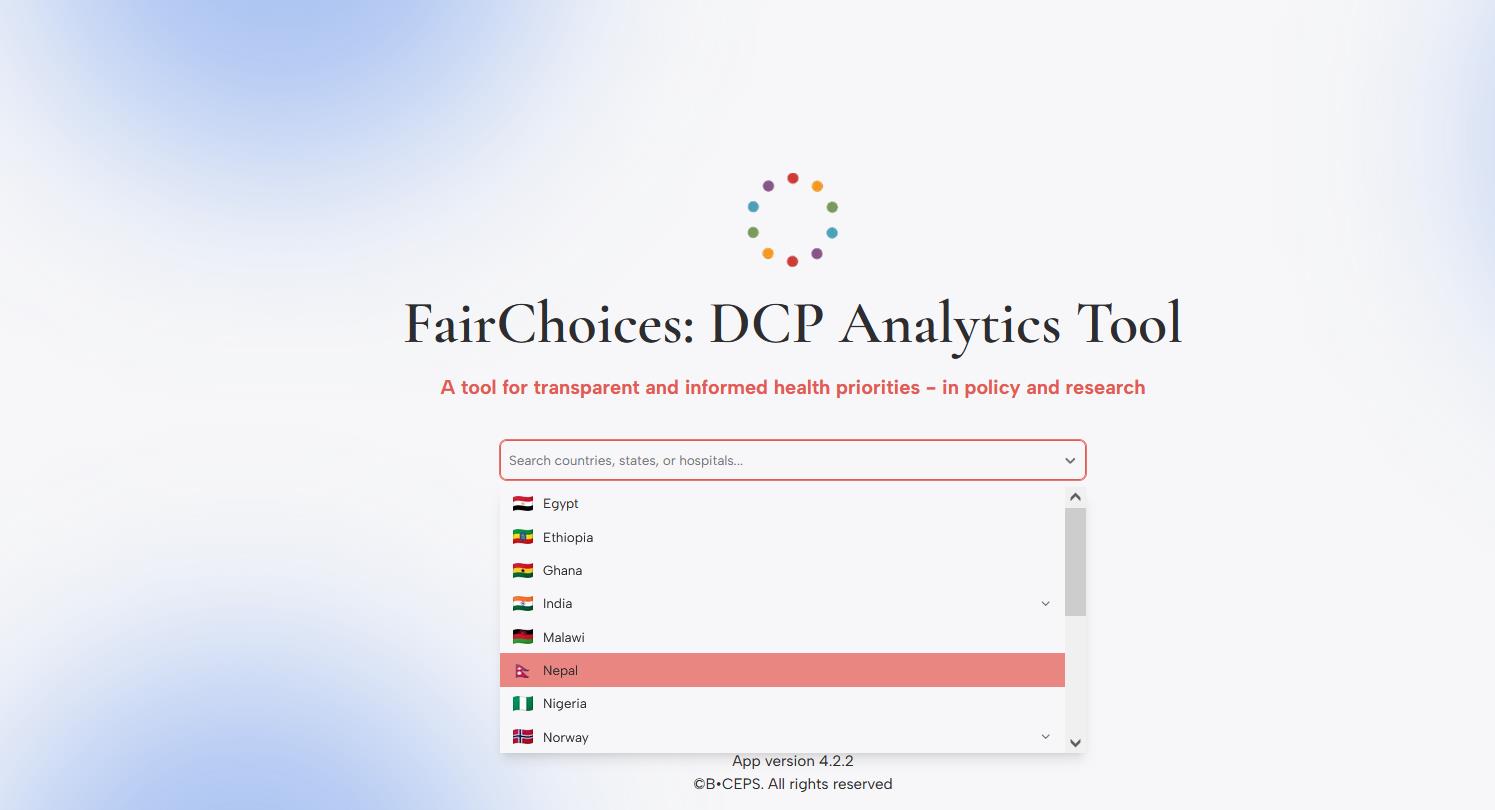
Country selection dropdown with flags and country names
How to Select a Location
- Click on the search bar on the homepage
- Type the name of your country or select from the dropdown list
- Click on your desired location
- FairChoices will automatically navigate to the location’s home page
Available Countries
FairChoices includes data for multiple countries including Egypt, Ethiopia, Ghana, India, Malawi, Nepal, Nigeria, and Norway. The list is continuously expanding.
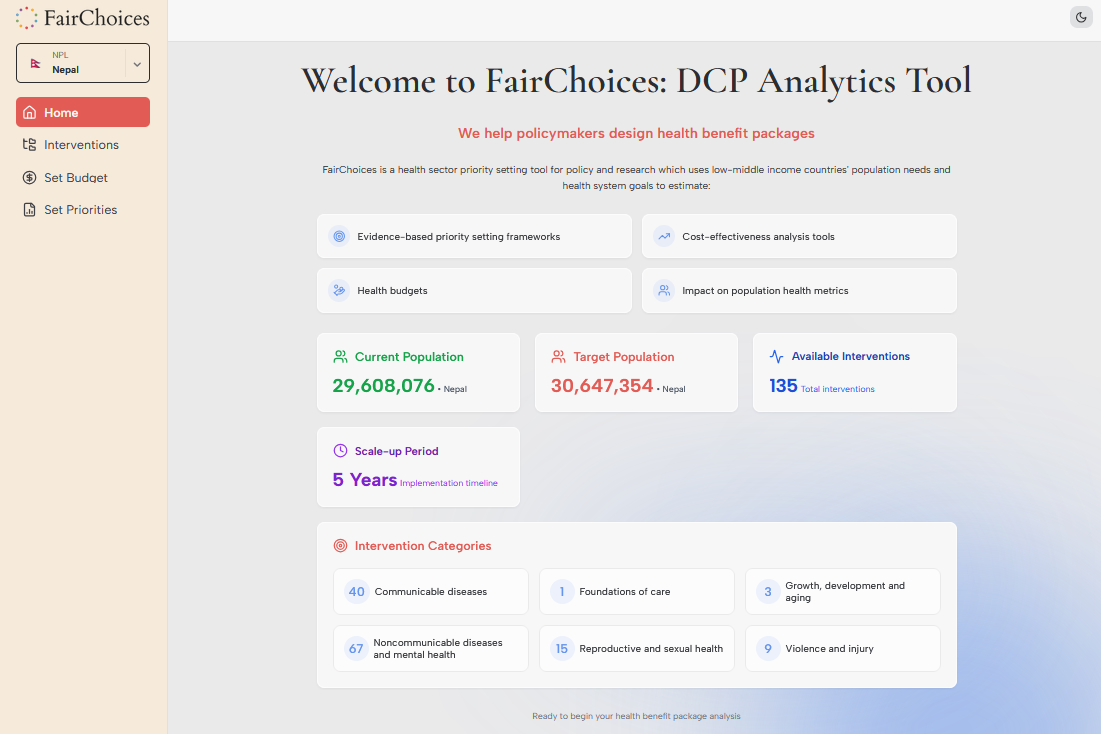
Location Home Page
Once you select a location, you’ll be taken to the location home page which displays:
- Current and target population statistics
- Number of available interventions (typically 135+)
- Default scale-up period (5 years)
- Intervention categories organized by health area
Navigation
FairChoices uses a sidebar navigation system that provides easy access to all main features. The sidebar is always visible on the left side of the screen.
Sidebar Menu Options
| Menu Item | Icon | Description |
|---|---|---|
| Home |  |
Overview of selected location with key statistics and intervention categories |
| Interventions | Browse and search the complete intervention taxonomy based on WHO UHC Compendium | |
| Set Budget | Configure budget parameters and financing projections for health interventions | |
| Set Priorities | Access the League Table for priority setting and cost-effectiveness analysis |
Sidebar Management
You can minimize the sidebar to save screen space:
- Hover over the sidebar and click the pointer (<) next to the FairChoices logo
- The sidebar will collapse to show only icons
- Hover over the minimized sidebar and click the pointer (>) to expand it again
Location Switching
The selected location is displayed at the top of the sidebar. Click on it to change to a different country or region.
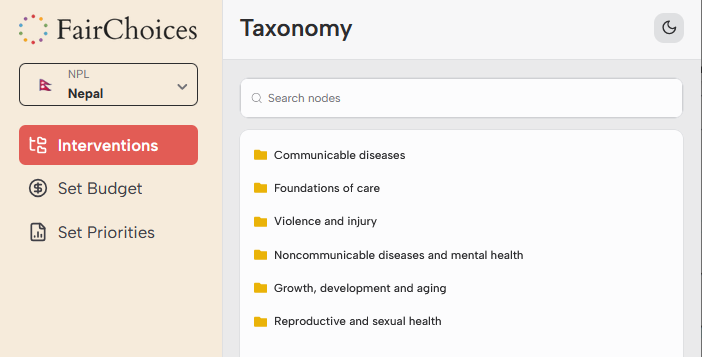
Interventions
The Interventions section provides access to FairChoices’ comprehensive intervention taxonomy, organized according to the WHO UHC Compendium structure.
Intervention Categories
Interventions are organized into six main categories:
- Communicable diseases: Including prevention, treatment, and control measures
- Foundations of care: Basic healthcare services and infrastructure
- Violence and injury: Prevention and treatment of injuries
- Noncommunicable diseases and mental health: Chronic disease management and mental health services
- Growth, development and aging: Maternal, child, and elderly care
- Reproductive and sexual health: Family planning and reproductive services
Searching for Interventions
Use the search functionality to quickly find specific interventions:
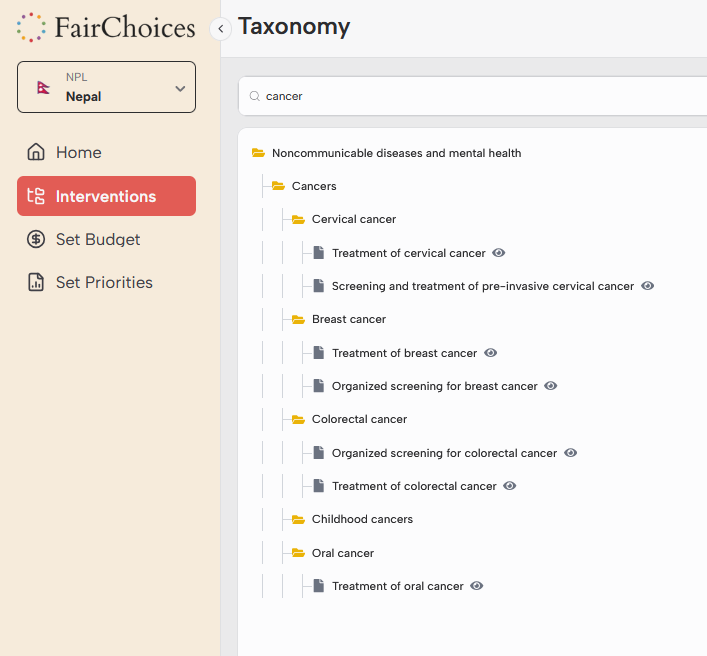
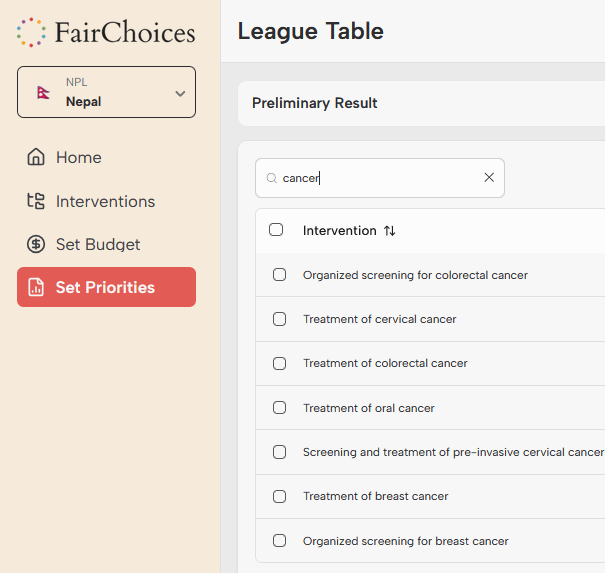
Search results for “cancer” showing related interventions
Accessing Evidence
Each intervention includes detailed evidence briefs:
- Navigate to the intervention of interest
- Click the eye icon (👁️) next to the intervention name
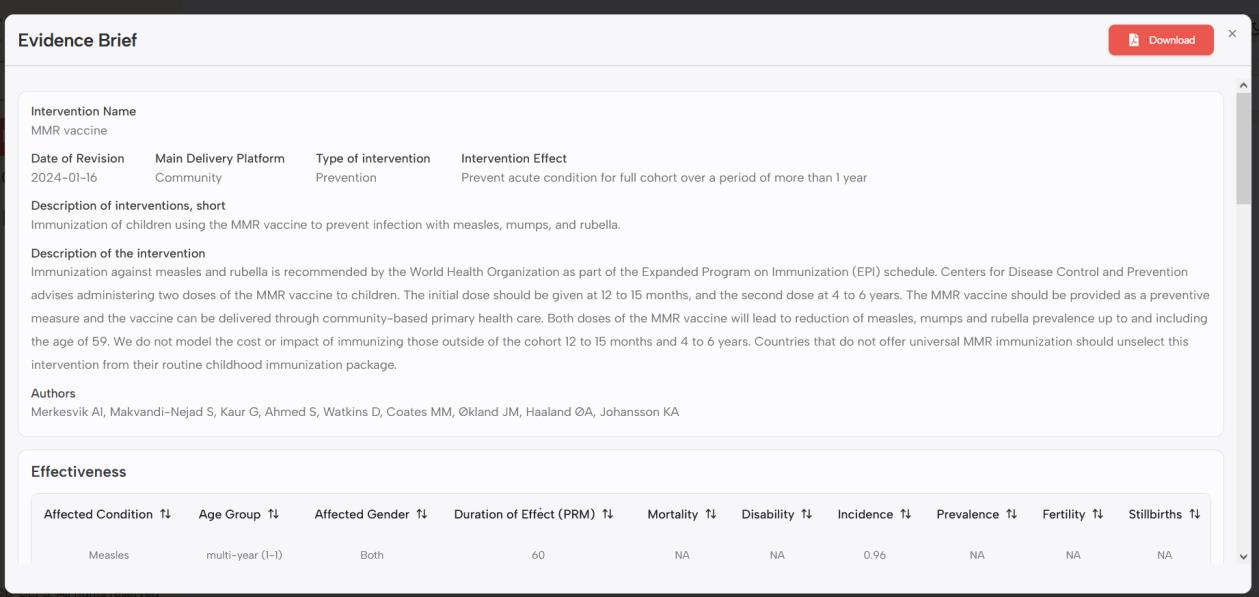
- Review the evidence brief which includes:
- Intervention description and delivery platform
- Effectiveness data with mortality and disability reductions
- Target conditions and age groups
- Author information and revision dates
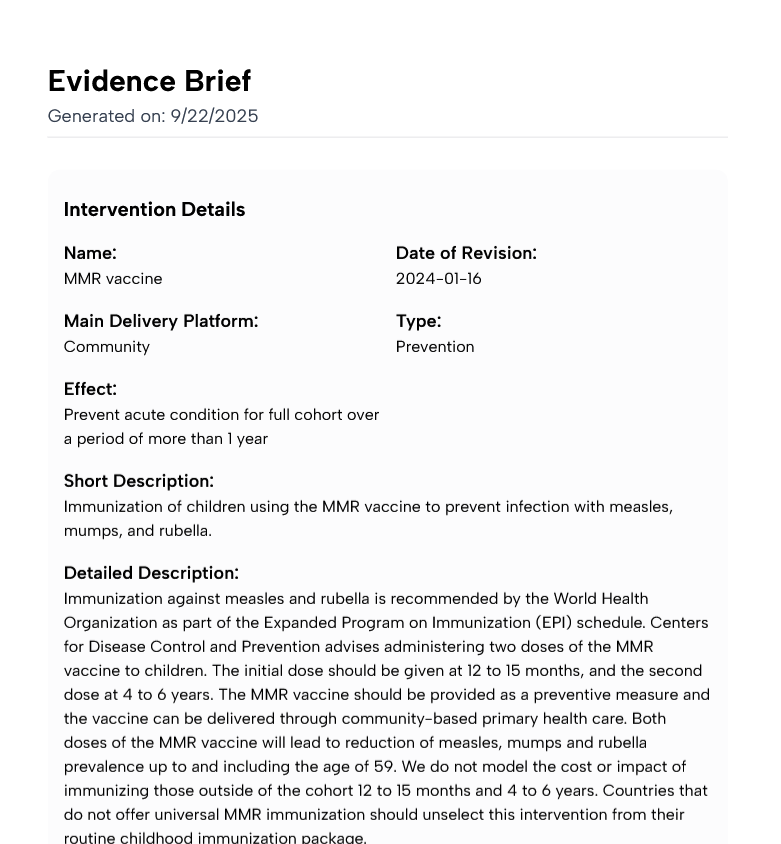
- Download the evidence brief as a PDF using the red Download button

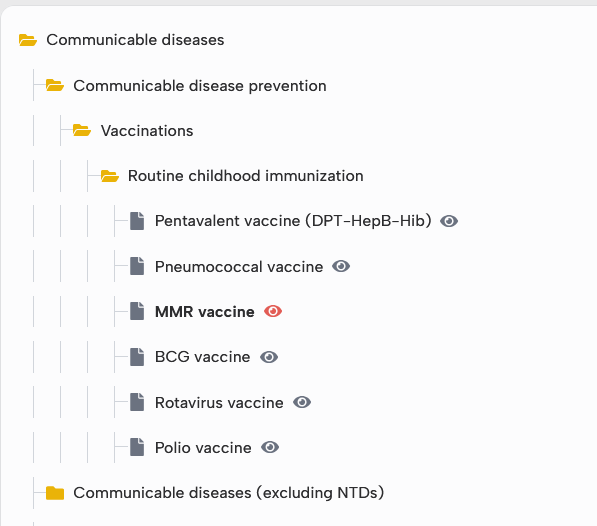
Navigate to the folder and click on any of them to get information
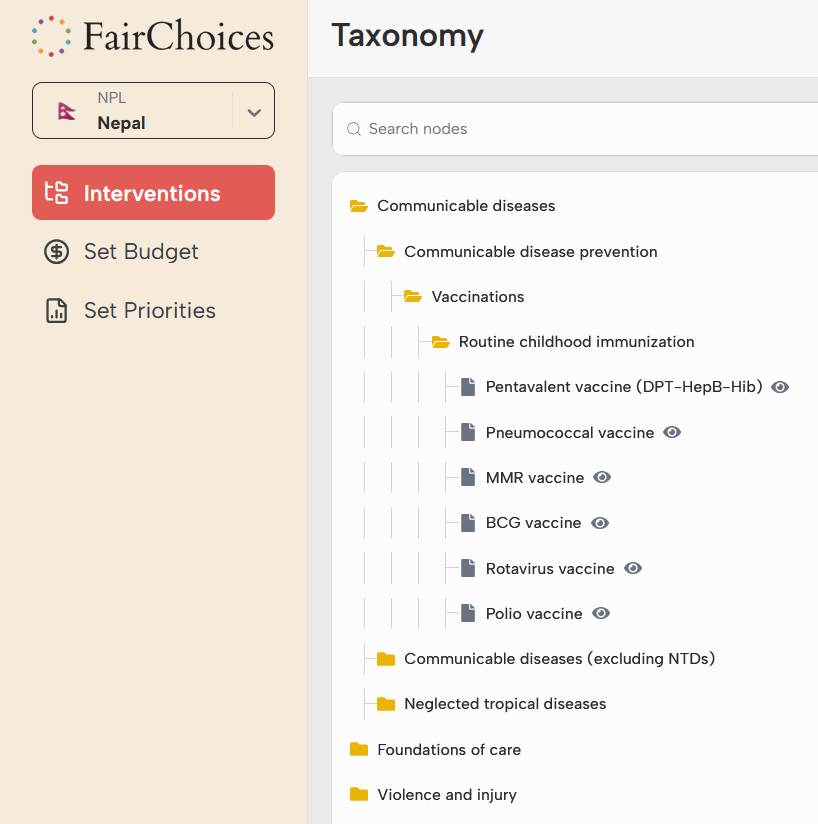
To see the evidence behind an intervention, click on the eye shaped icon at the right side of the intervention of interest
Clicking the red eye, the following evidence brief appears
Downloaded PDF
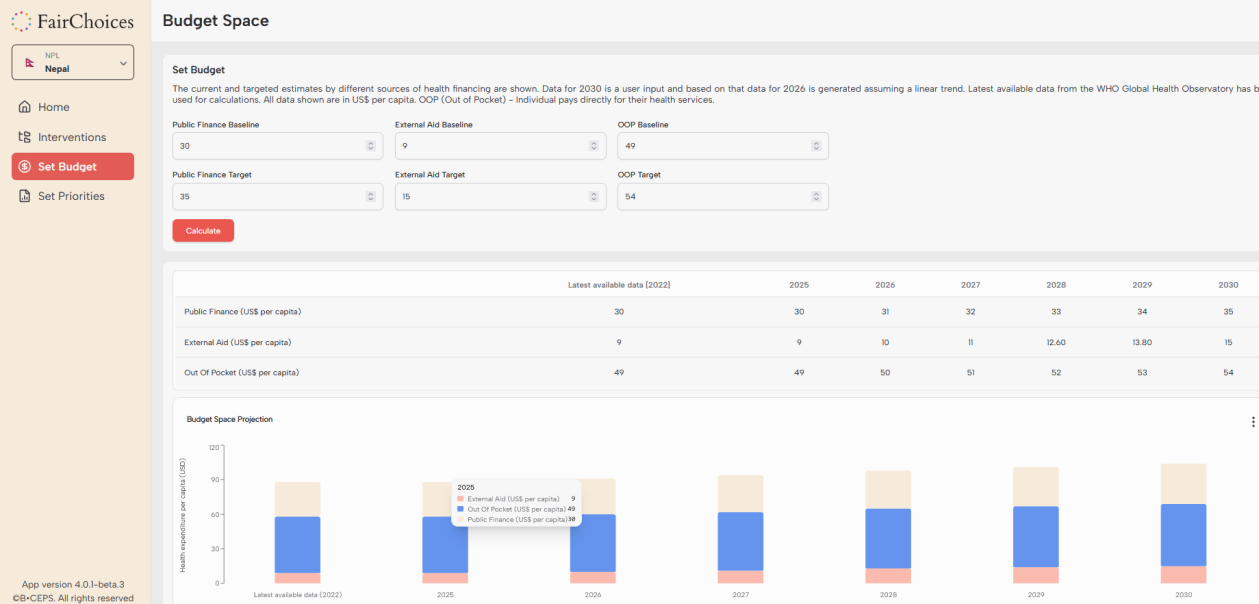
Budget Setting
The Set Budget section allows you to project health financing five years into the future, considering Public Finance, External Aid, and Out-of-Pocket expenditures.
Budget Components
Public Finance
Government health spending including domestic health budget allocations
External Aid
International development assistance and donor funding for health
Out-of-Pocket
Direct household spending on healthcare services and products
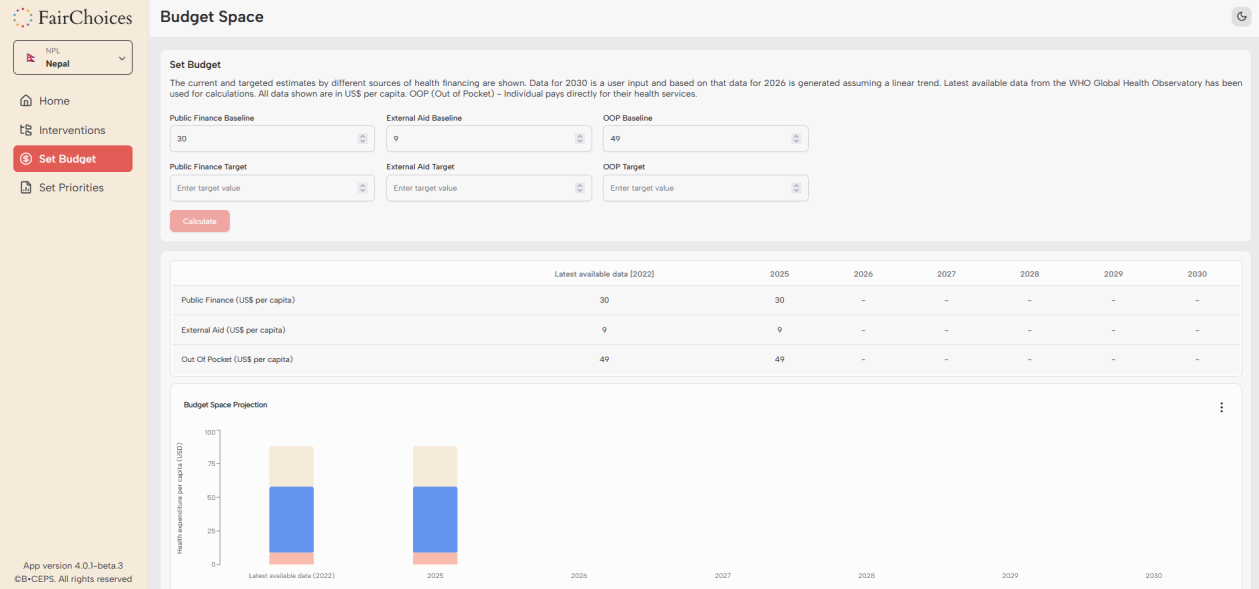
Setting Budget Parameters
- Baseline Values: Input current (year 0) financing levels for each component
- Target Values: Set desired financing levels for year 5
- Calculate: Click the red Calculate button to generate projections
- Review Results: Analyze the linear trend projections and visualizations
Data Sources
Default baseline values are based on WHO Global Health Observatory and WHO’s Global Health Expenditure database. Users should input their own up-to-date data for accurate analysis.

Budget Space Projections
The tool generates several visualizations:
- Annual financing projections table (2020-2025)
- Stacked bar charts comparing baseline and target years
- Per capita financing analysis
- Total budget space calculations
Priority Setting
The Set Priorities section contains the League Table, which is the core analytical tool for comparing health interventions and making priority-setting decisions.
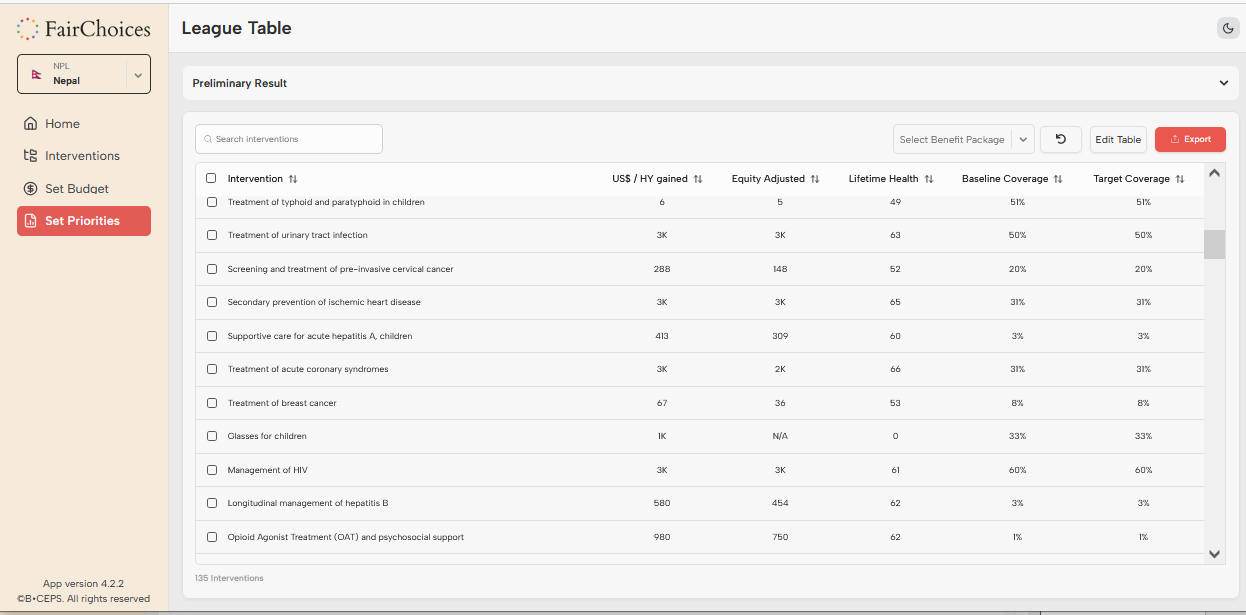
League Table Overview
The League Table displays interventions with key metrics for comparison:
| Column | Description | Interpretation |
|---|---|---|
| Intervention | Name of the health intervention | Click to select for analysis |
| Baseline Coverage % | Current population coverage | Higher values indicate better current access |
| Target Coverage % | Desired coverage after 5 years | Set by user for scenario analysis |
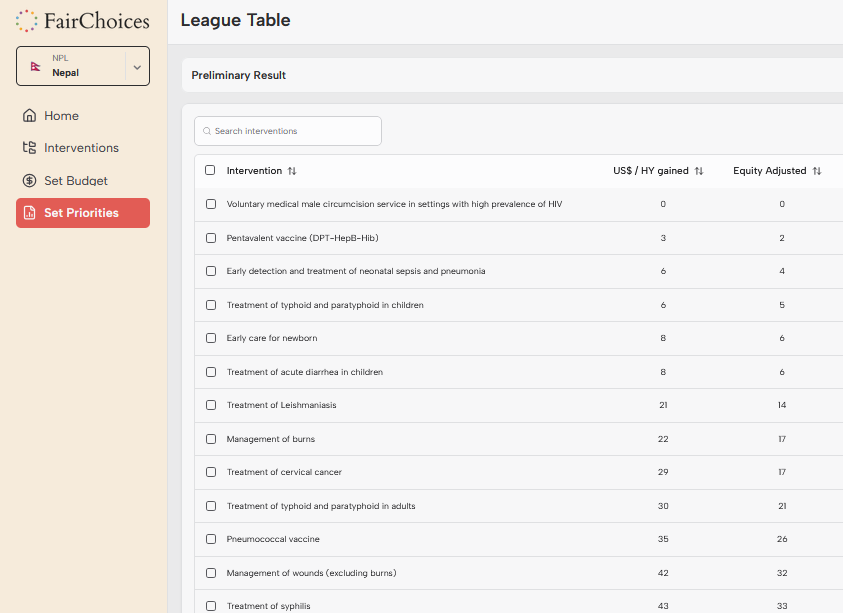
| US$/HY gained | Cost per healthy year gained | Lower values indicate better cost-effectiveness |
| Equity Adjusted | Cost-effectiveness adjusted for severity | Accounts for interventions targeting severe conditions |
| Lifetime Health | Average healthy years for affected population | Lower values indicate more severe conditions |
- Baseline coverage is the percentage of the population in need which currently has access to an intervention. For example, if the baseline coverage of Management of HIV is 60%, this means that 60% of the population in need of this intervention currently have access to it.
- Target coverage is the coverage we aim for after the 5-year scale-up period. By default, target coverage equals baseline coverage (i.e., no scale-up). If target coverage is adjusted, FairChoices projects the costs, health gains, and other policy-relevant information five years into the future.
-
The cost-effectiveness is calculated by the following formula:
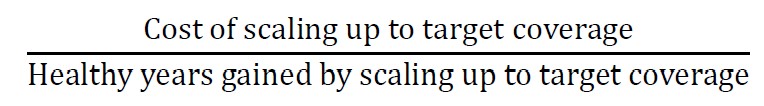 The lower the ratio, the higher the cost-effectiveness of the intervention.
 - Lifetime health indicates how many healthy years a person obtains over their life span if they suffer from a condition targeted by an intervention. A low lifetime health means that the intervention targets a condition that is severe in the sense that large health losses (including death) occur early in life. For example, if the Lifetime health of MMR vaccine is 7, this means that MMR vaccine targets conditions that tend to hit children, and that the average person with measles, mumps, or rubella does not get more than 7 healthy years during their life course.
- Equity adjusted is a measure of cost-effectiveness that takes lifetime health into account. The lower the lifetime health, the more the equity adjusted cost-effectiveness is reduced compared to the regular cost-effectiveness (i.e., total cost divided by healthy years gained). Using equity adjusted cost-effectiveness instead of regular cost-effectiveness will therefore give higher priority to interventions providing health to children and young adults.
Sorting and Filtering
Use the sorting and filtering features to focus on relevant interventions:
Sorting
- Click column headers once to sort in ascending order
- Click twice to sort in descending order
- Use this to identify most cost-effective interventions
Default League Table for Nepal
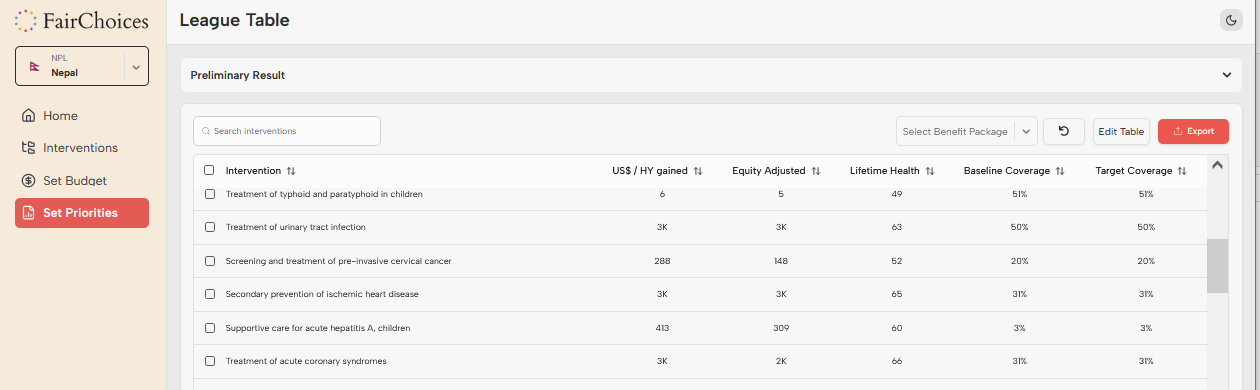
click the arrows next to the heading “Equity adjusted” one time
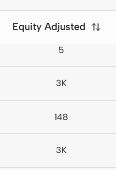
health interventions are sorted according to equity adjusted cost-effectiveness
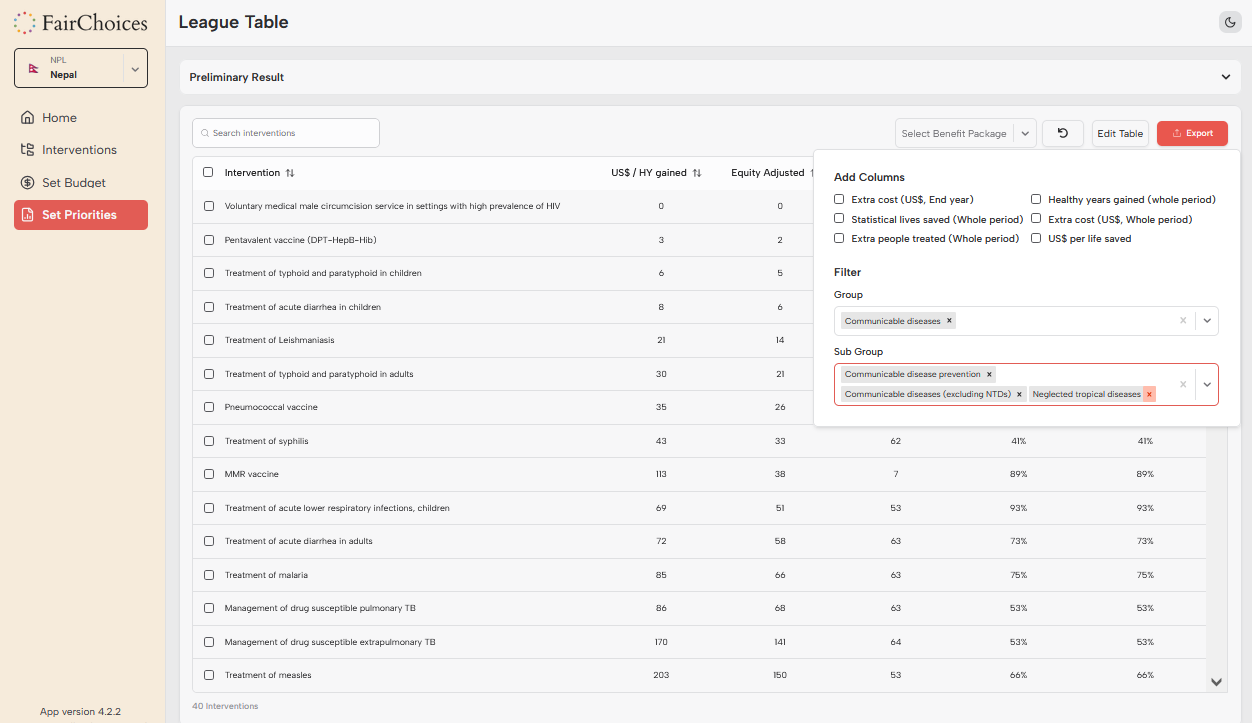
Filtering Options
- Text Search: Use the “Search interventions” box to filter by keyword
- Group Filter: Click “Edit Table” then filter by intervention categories
- Sub-group Filter: Further refine by specific intervention types
Filter by Name
Filter using Edit Table button
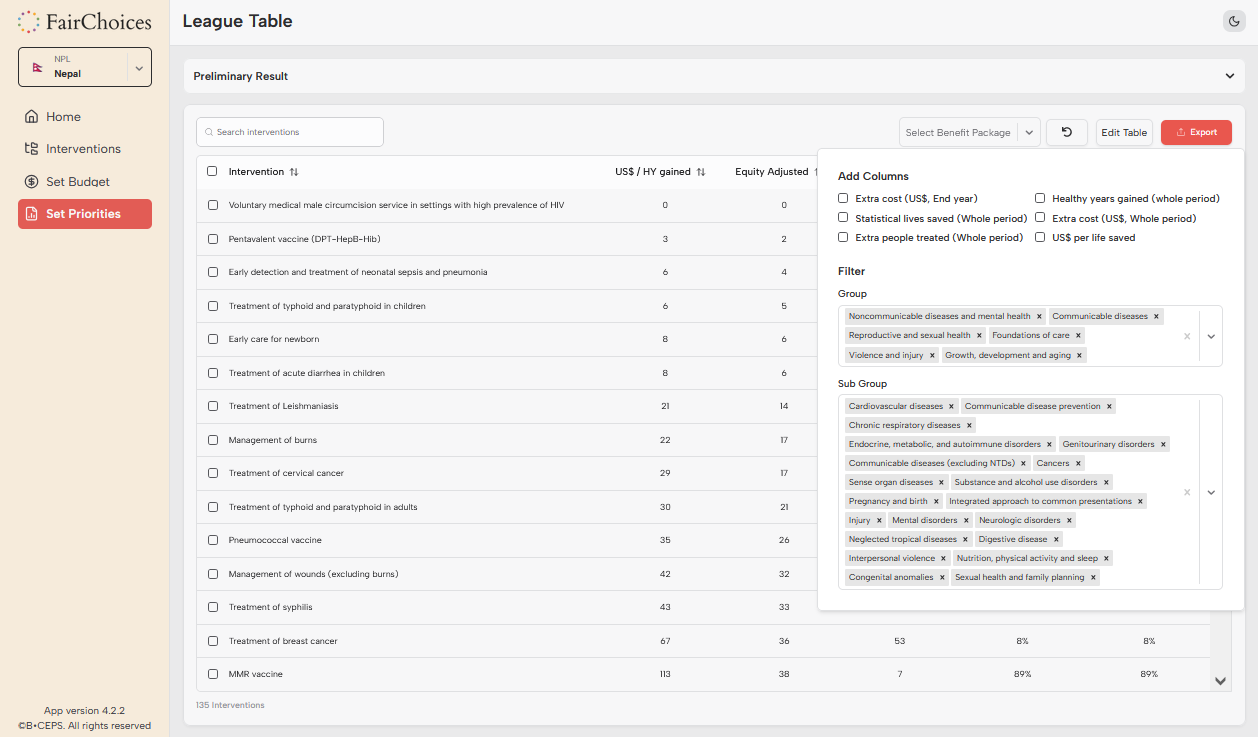
When you have selected one or more groups of interventions, you can further filter by sub group under the heading Sub Group. Click on the x next to the sub groups that you want to exclude from a League table.
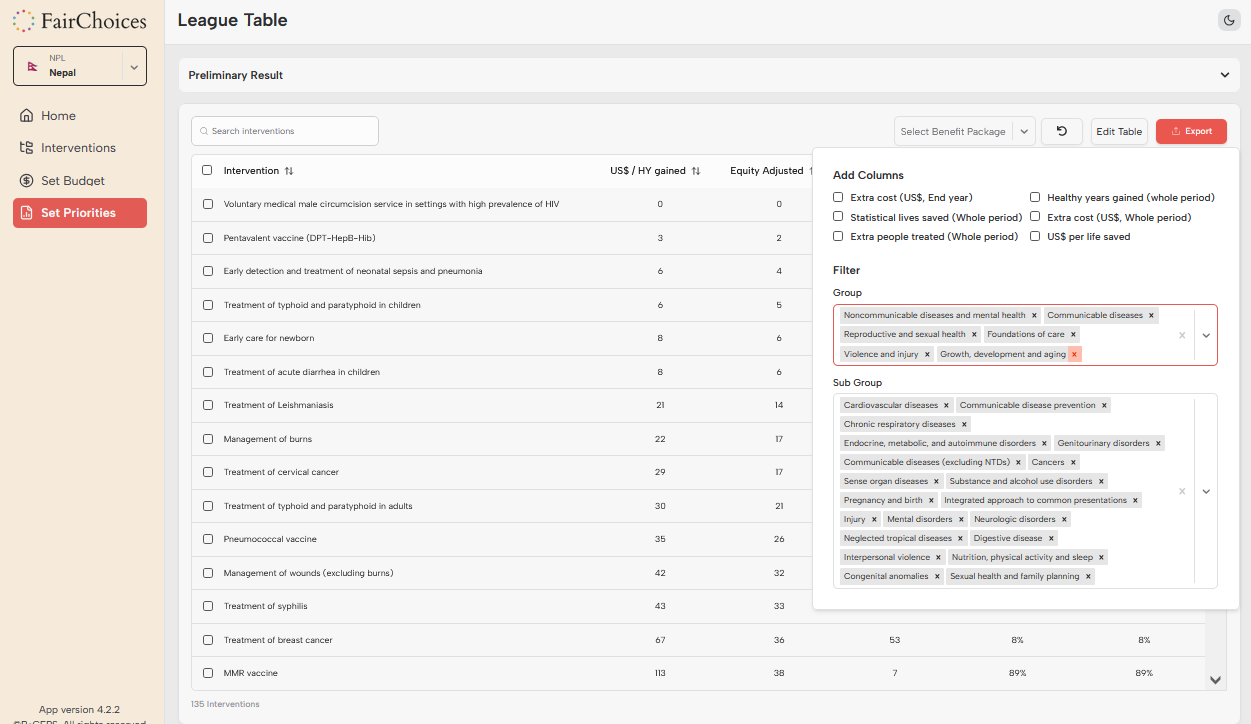
Adding Columns
Customize your analysis by adding additional data columns:
- Extra cost (US$ End year)
- Healthy years gained (whole period)
- Statistical lives saved (Whole period)
- Extra cost (US$, Whole period)
- Extra people treated (Whole period)
- US$ per life saved
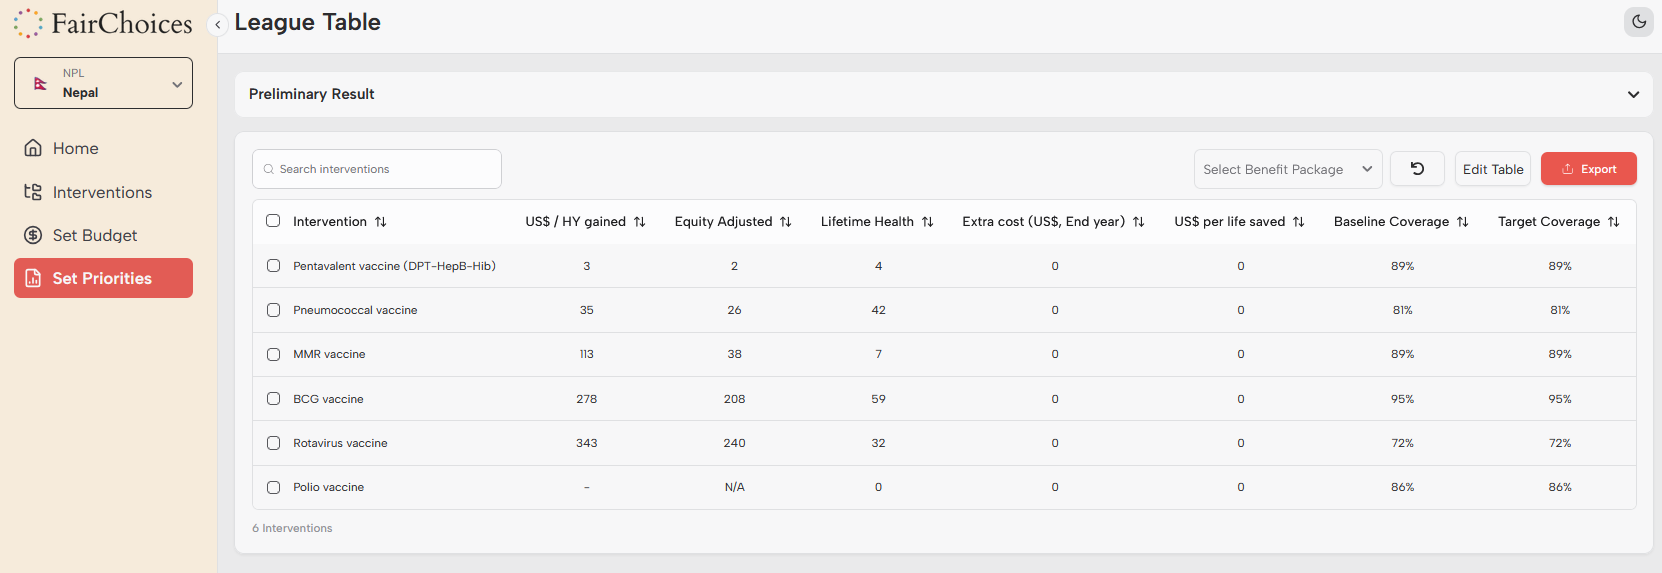
You can add columns to the league table by clicking the Edit Table button. Under Add Columns, the optional additional information that is displayed: Extra cost (US$ End year), Healthy years gained (whole period), Statistical lives saved (Whole period), Extra cost (US$, Whole period), Extra people treated (Whole period), US$ per life saved. Clicking on the options will include for example Extra cost (US$ End year) and US$ per life saved:
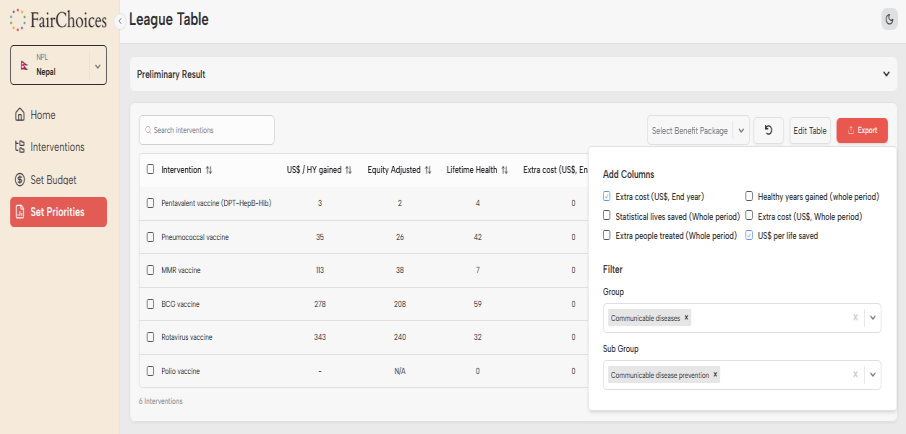
Now, the League table automatically updates and displays the extra columns that you have chosen. You can move right and left by clicking the horizontal bar below the table. Remember to try this if you cannot find the column you just added.
Analyzing Results
Once you’ve selected interventions and set target coverage levels, FairChoices provides comprehensive analysis through the Impact Explorer.
Setting Target Coverage
- Select interventions by checking the boxes next to their names
- Use “Set Target (%)” to specify absolute coverage levels
- Use “Increase By (%)” to specify percentage point increases
- Click the blue checkmark button to apply changes
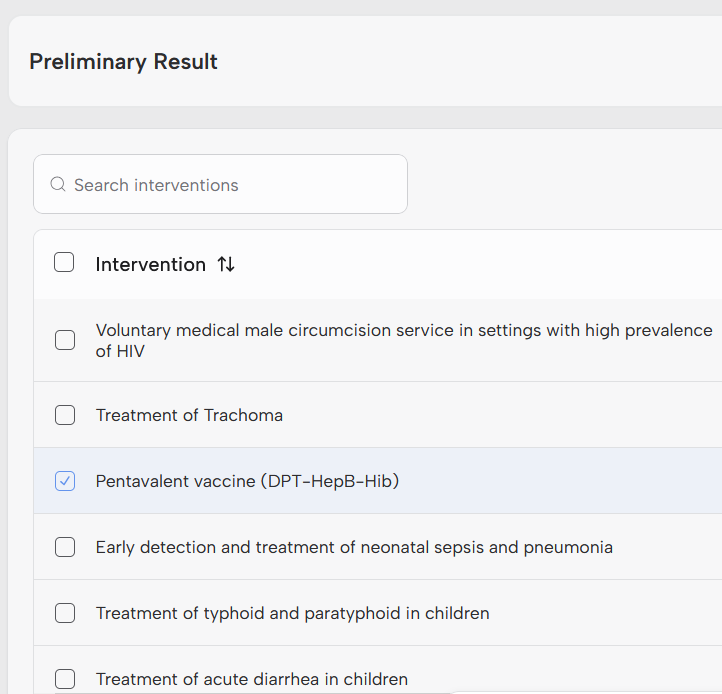
To adjust the Target coverage, first click the little white box at the left side of one or more of the interventions of interest in the list of interventions, for example the box next to the health intervention Pentavalent vaccine (DPT-HepB-Hib):
Then, boxes with new options appear at the bottom of the table:
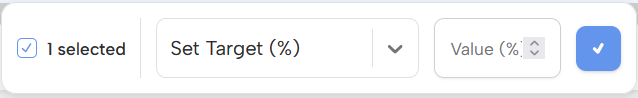
The box on the left shows the number of interventions you have selected, in this case 1. If you want to estimate the health gains and financial costs of increasing the coverage of the selected interventions over the next five years, go to the box with the title Set Target (%) or the downward pointer at the right side of it. When you have clicked it, two different options for setting target becomes visible; Set target % and Increase by (%):
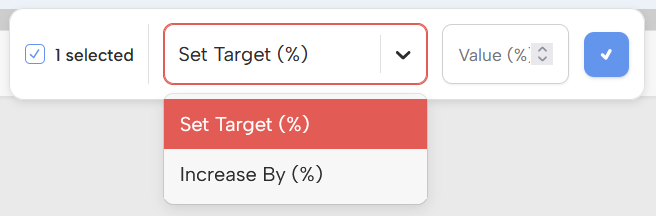
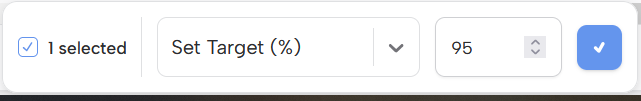
If you want to measure the upscaling of the selected intervention by filling in the absolute percentage of coverage five years into the future, click the Set Target (%) option with the mouse. Next, click the mouse to the box to the left and fill in the percentage that you would like to have as the target coverage for your selected health intervention to be five years from now. For example, you may fill in the number 95 if you want to the coverage of the health intervention Pentavalent vaccine (DPT-HepB-Hib) is being increased (from 89 % baseline coverage, which indicates the coverage of this health intervention the current year) to 95 % in five years from now.
If you instead want to measure the upscaling of the selected health intervention by filling in how many percentage points you want the coverage to increase from baseline coverage the current year to the target coverage in the final year, click the Increase By (%) option with the mouse
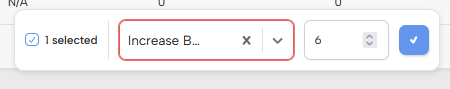
Next, click the mouse to the box to the left and fill in the percentage point increase that you would like to have as the target coverage for your selected health intervention in five years from now. In this example, the number is 6, because we want to estimate the costs and health gains following a 6% increase from 89% baseline coverage of the current year to 95% the target coverage in five years from now. When you have filled in the future upscaling using either Set Target (%) or Set Increase (%), you can estimate the financial costs and health gains that follows from the future upscale of the intervention by click the blue button with the white mark on it to the left of the box where you just filled in the number.To see preliminary estimates, click the at top right corner. Now you get some key estimates for the financial costs and health gains that follow from the upscaling of the selected health intervention(s):
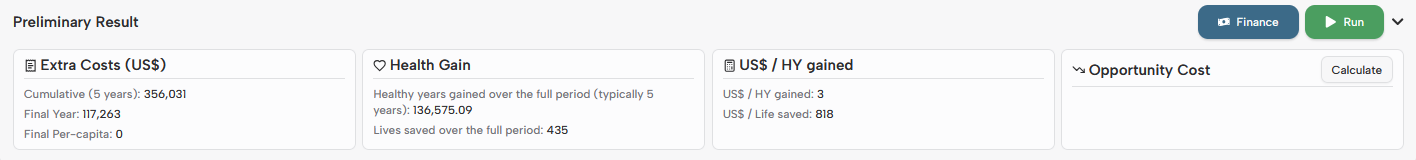
Impact Explorer
The Impact Explorer provides detailed analysis across three main areas:
1. Health Effects
- Deaths Averted by Age: Line graphs showing averted deaths across age groups
- Deaths Averted by Cause: Analysis of which conditions are most impacted
- Interactive Charts: Sunburst diagrams combining age and cause data
- Summary Statistics: Total deaths averted, healthy years gained, lives saved
2. Demographic Impact
- Population Projections: Age-specific population trends
- Mortality Projections: Death rates by age group
- Population Pyramids: Age-sex distribution comparisons
- Fertility Analysis: Total and age-specific fertility rates
3. Cost Analysis
- Annual Cost Projections: Year-by-year cost estimates
- Cost by Intervention: Breakdown of costs for selected interventions
- Cost Components: Detailed unit costs and impact properties
- Cost-Effectiveness: US$ per healthy year gained calculations
Opportunity Cost Analysis
FairChoices calculates opportunity costs to show the health benefits lost by not choosing the most cost-effective interventions:
Example: “HYs lost compared to most cost-effective use of money: 13,100” indicates that the current selection could have achieved 13,100 additional healthy years if resources were allocated to more cost-effective interventions.
Changing Locations
You can easily switch between different countries or regions to compare analysis across locations.
How to Change Location
- Open the sidebar menu
- Click on the currently selected country name
- Select your new location from the dropdown
- FairChoices will automatically update all data and analysis
Cross-Country Comparison
When changing locations:
- All intervention data updates to the new location
- Population and epidemiology data refreshes
- Budget parameters reset to location-specific defaults
- Current navigation position is maintained
Best Practices
Use location switching to compare how the same interventions perform in different contexts, or to analyze how health priorities might differ across regions with similar characteristics.
Tips & Tricks
Maximize your efficiency with FairChoices using these expert recommendations:
Navigation Efficiency
- Minimize Sidebar: Use the collapsed sidebar view for more screen space
- Bookmark Locations: Save frequently analyzed countries for quick access
- Use Search: Quickly find interventions using the search function rather than browsing categories
Analysis Best Practices
- Start with Baseline: Always review current coverage levels before setting targets
- Consider Equity: Use equity-adjusted cost-effectiveness for fairer priority setting
- Test Scenarios: Try different coverage levels to understand impact curves
- Review Opportunity Costs: Always check what health benefits are being sacrificed
Data Interpretation
- Focus on Rankings: Relative cost-effectiveness is often more important than absolute values
- Consider Context: Factor in local health system capacity and implementation feasibility
- Use Multiple Criteria: Don’t rely solely on cost-effectiveness – consider equity and severity
- Validate Assumptions: Cross-check key parameters with local experts when possible
Collaboration Tips
- Export Results: Download evidence briefs and results for stakeholder sharing
- Document Decisions: Keep notes on why specific interventions were selected
- Engage Stakeholders: Use visualizations to facilitate policy discussions
- Iterative Process: Return to analysis as new data becomes available
Remember
FairChoices is a decision-support tool, not a decision-making tool. Always combine quantitative analysis with qualitative considerations, stakeholder input, and local expertise when making health policy decisions.