- Summary
- General Guidelines and Rules of Thumb
- System Architecture
- File Structure
- Extracting Data from Global Burden of Disease
- Clean
- Scripts
FairChoices Architecture
Table of Contents
- Summary
- General Guidelines and Rules of Thumb
- System Architecture
- File Structure
- Extracting Data from Global Burden of Disease
- Clean
- Scripts
Summary
FairChoices includes an online user interface designed to guide the development of health benefits packages, with a strong emphasis on intervention cost-effectiveness. The platform also comprises an input tool for data entry and updates, as well as a validation tool to ensure data quality and consistency. The analyses presented in the tool and in this paper are generated using the underlying back-end models.
We use two technologies and/or frameworks to power FairChoices:
- R programming language: For writing the component code that computes the end-to-end analytical tool.
- Shiny: A package that makes it easy to build interactive web apps straight from R.
React JS: We have a beta version of the web interface and input tool under development.
General Guidelines and Rules of Thumb
Data frame in, data frame out: Generally, any integration between components — for example, the loading of clean data into the impact model or the integration between the impact model and the demography model — should be formatted in a data frame. You can do whatever computation you want within a particular component — transform the data frame into a matrix, break out several individual vectors, whatever is optimal — but generally try to keep the integration between components in a data frame format. This helps with legibility, data storage, logging, and testing as each step along the way will be able to produce a human-readable, simplified output.
System Architecture
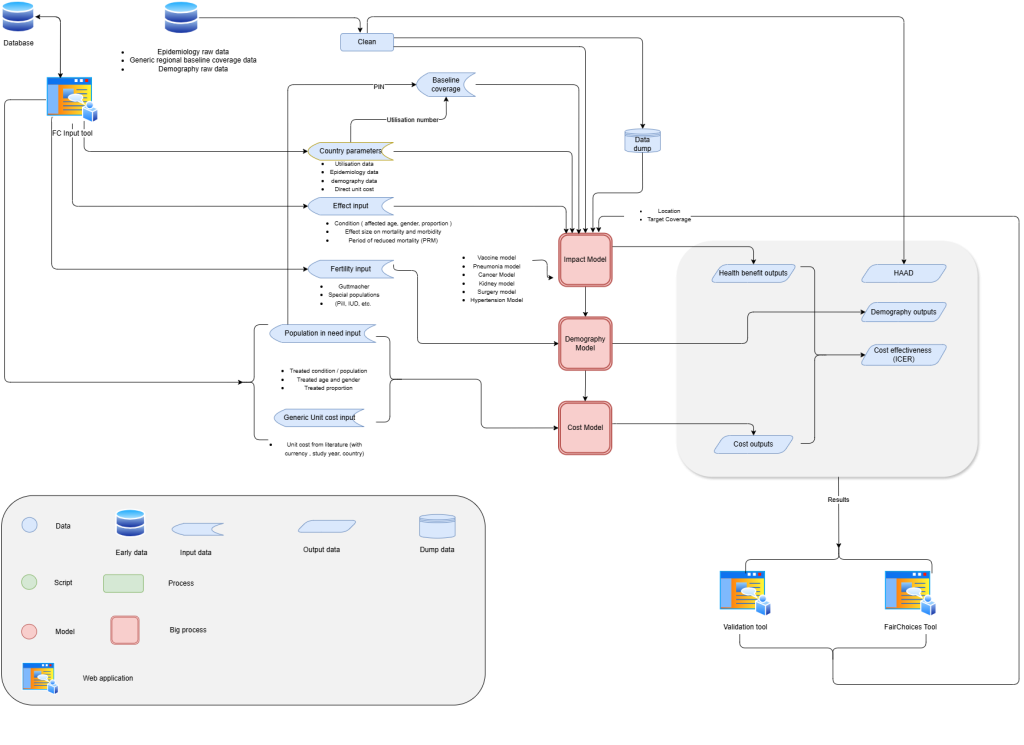
Fig. 1: System architecture diagram of FairChoices model
File Structure
FairChoices/
├── config/
│ └── init.R # Environment setup and initialization
│
├── data/
│ └── *.csv / *.rds # Raw and processed data files
│
├── scripts/
│ ├── clean/ # Scripts for cleaning and preprocessing data
│ ├── fxns/ # Custom R functions used across the app
│ ├── model/ # Model logic and statistical scripts
│ ├── objects/ # Precomputed objects or constants used in the app
│ └── process/ # Scripts for processing or transforming data
│
├── user-interface/
│ ├── app/ # Main Shiny app entry point
│ │ │── src/
│ │ │ ├── global.R # Global variables and shared code
│ │ │ ├── ui.R # User interface layout
│ │ │ └── server.R # Server logic
│ └── [other_shiny_apps]/ # Additional modular Shiny apps, if any
│
├── api/
│ ├── controllers/ # Logic for handling API requests
│ ├── models/ # Data models and business logic for API
│ ├── functions/ # Helper functions for APIs
│ │── plumber.R # API routes and Plumber configuration
Extracting Data from Global Burden of Disease
https://vizhub.healthdata.org/gbd-results
- GBD Estimate: Cause of death or injury
- Measures: Deaths, YLDs (Years of Lived with Disability), Prevalence, Incidence
- Metric: Number, Rate
- Cause: Select all causes
- Location: Select all countries and territories (filter in cleaning)
- Age: Select all (filter in cleaning)
- Sex: Male, Female, Both
- Year: 2019
- GBD Estimate: Impairment
- Measures: YLDs (Years of Lived with Disability), Prevalence
- Metric: Rate
- Impairment: Select all impairments (filter in cleaning*)
- Cause: Select all causes
- Location: Select all countries and territories (filter in cleaning)
- Age: Select all (filter in cleaning)
- Sex: Male, Female, Both
- Year: 2019
- GBD Estimate: Etiology
- Measures: Deaths, YLDs (Years of Lived with Disability)
- Metric: Rate
- Etiology: Select all etiologiess (filter in cleaning*)
- Cause: Select all causes
- Location: Select all countries and territories (filter in cleaning)
- Age: Select all (filter in cleaning)
- Sex: Male, Female, Both
- Year: 2019
- GBD Estimate: Injuries by nature
- Measures: YLDs (Years of Lived with Disability), Prevalence, Incidence
- Metric: Rate
- Injury: Select all injuries (filter in cleaning*)
- Cause: Jan-Magnus to figure out
- Location: Select all countries and territories (filter in cleaning)
- Age: Select all (filter in cleaning)
- Sex: Male, Female, Both
- Year: 2019
Clean
Cleaning data can be done through a data cleaning script (saved in the scripts/clean folder).
Rules:
- All
cleaneddata should be reflected in the PostgreSQL schema. - Clean data tables should be stored in long format.
- Clean data tables should have as little overlapping information (i.e., columns) with other clean data tables.
Scripts
The scripts/clean folder contains scripts that take raw data, clean them, and save them to data/clean. This data will be used by a wide variety of FairChoices users and will be the input data for all subsequent analytic (e.g., demography, epidemiology, etc.) scripts.
Rules:
The beginning of each script must contain basic metadata on where the raw data came from. Include information on the data source, including the URL if relevant, as well as who was responsible for processing the raw data and the date it was last processed (see example below). The scripts/clean folder contains a template (scripts/clean/template.R) to help users getting started.
    # Source:
    # - World Population Prospects 2022
    # - https://population.un.org/wpp/Download/Standard/MostUsed/
    # Proccessor:
    # - Sarah Bolongaita
    # - 2023-05-12